Another Dublin Literacy Conference has come and gone. It was an outstanding day of learning and sharing. Check out the twitter conversations at #dublit12. The day couldn't have gone better. Here is the presentation that I was fortunate enough to share with teachers at the conference.
Sunday, February 26, 2012
Wednesday, February 15, 2012
ETech 2012 Wrapup
Over the last 3 days, I've been fortunate enough to be able to attend Ohio's ETech Conference in Columbus. I was able to attend many wonderful sessions and spend time with my technology colleagues. I was also able connect with a few of my Twitter tech friends that were in attendance. Now it's time to analyze what I saw and see what we can use/share with our teachers. Here is some of what I saw.
Teaching Writing in the 21st Century Classroom
Presented by Matt Gillispie. He and a couple of his colleagues shared different tools and websites that helped with the teaching of writing. Key tools shared-
Neatchat.com
Puppet Pals for the iPad
Socrative.com
Screenr.com
Voicethread
Edmodo.com
Schoology.com
A Keynote Address given by Dr. Michio Kaku
speech similar to this one on YouTube
Students Leaving a Legacy: A Student Created Digital Wiki-textbook
Garth Holman and Mike Pennington talk about their digital textbook and collaborating on the project with their students. Here is the link to their digital text.
Google Forms for Everything!
Eric Curts of North Canton City Schools talked about the uses of Google Forms - presentation link here
It Takes a Village: Innovative Ways to Collaborate
Holly Harwood shared many ways teachers can collaborate to help learn and share techniques and materials for class. Her presentation was shared on their wiki.
Jump into the Cloud, Google Apps for Eudcation Edition for your SchoolAnthony Luscre, Mogadore Local Schools
Link to his presentation.
He also has presentation and tech materials available at http://searchfindknow.com
Also attended his session entitled
Creating District, Building, Classroom and/or Student Websites using WeeblyLink to the presentation.
A Keynote Address given by Brene Brown, entitled Teachable Moments: Bringing Courage, Compassion and Connection to the Classroom. The Keynote was outstanding. She has given multiple Ted Talks. You might like to see them. Try this one.
http://www.ted.com/talks/brene_brown_on_vulnerability.html
As you can see, there was a variety of information to absorb and process. That's my goal over the next few weeks. Check out these resources and see if any are right for you.
Wednesday, February 1, 2012
Dublin Literacy Conference 2012
Getting ready for the Dublin Literacy Conference. Preparations have begun on a presentation about Web 2.0 Tools for teachers to help with literacy. I am creating a collection of tools with examples of how they can be used in the classroom. How can teachers and students learn and demonstrate learning using those tools. I will share it here once the conference has occurred.
Here is the link to the conference, if you are in the Columbus area and looking for a great way to spend a Saturday.

Saturday, Feb. 25, 2012
Dublin Coffman High School
Here is the link to the conference, if you are in the Columbus area and looking for a great way to spend a Saturday.
Dublin Coffman High School
Online Graphing Calculator
I recently ran across a graphing calculator online. It is very easy to navigate and allows the user to share the graphs they create. It is a product of Desmos. Within a couple of days, they had upgraded to a product that allows the user to create an account to save and share the graphs that they create, abettercalculator. This is awesome. Here is what the website looks like.
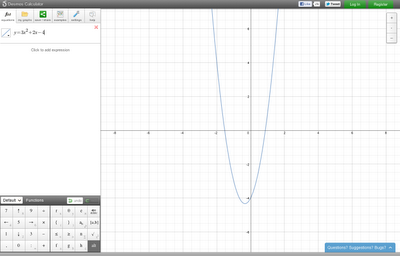
Along the left side, you get to enter equations, points, etc. It has a keypad, so you can choose numbers, letters, functions, etc. These are all browser based, which makes it very easy to navigate on an Interactive White Board. I think teachers will love this.
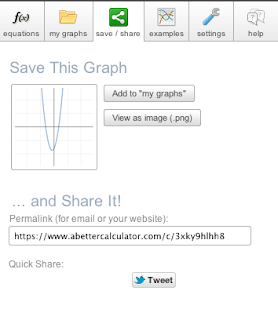
As I mentioned before, a logged-in user can save graphs into a folder, share the link to the graph, or save an image of the graph in .png format. It even allows the user to tweet out the result of the graph.

Along the left side, you get to enter equations, points, etc. It has a keypad, so you can choose numbers, letters, functions, etc. These are all browser based, which makes it very easy to navigate on an Interactive White Board. I think teachers will love this.
As I mentioned before, a logged-in user can save graphs into a folder, share the link to the graph, or save an image of the graph in .png format. It even allows the user to tweet out the result of the graph.

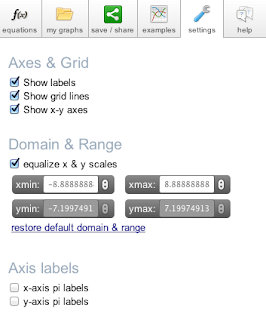
Another great feature is the customizable settings of the graph. You have control over the x-axis, y-axis, scales, etc. You can even use pi as a label. Nice for trigonometry. Give the page a try. It is probably a page you'll come back to frequently.

Subscribe to:
Posts (Atom)